What is IRIS?#
IRIS#
Interface Region Imaging Spectrograph (IRIS) is a NASA Small Explorer (SMEX) satellite. The mission statement of IRIS is to combine advanced numerical modeling with a high resolution, high throughput multi-channel ultraviolet (UV) imaging spectrograph fed by a 20 cm telescope, in order to understand how the solar atmosphere is energized and to understand how mass and energy flows through the chromosphere and transition region. IRIS data is also used for a wide range of other science topics including: solar flares, prominences, sunspots, coronal rain, spicules, and many more.
IRIS obtains UV spectra and images in two main passbands around 1400 Å and 2800 Å at high spatial resolution (~0.33”), time (~1s) and spectrally (~26 and ~53 mÅ respectively) that are focused on the chromosphere and transition region including light coverage of the corona.
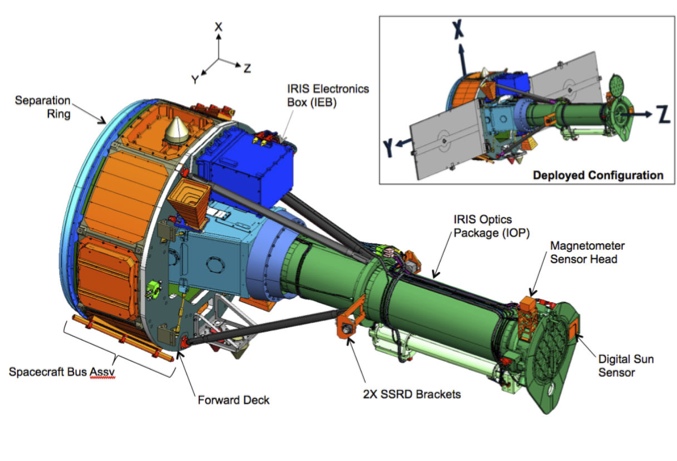
Schematic view of IRIS showing the 20 cm telescope, with and without solar panels (for clarity). Light from the Cassegrain telescope (green) is fed into the spectrograph box (light blue).#
The IRIS telescope feeds light from three passbands into the spectrograph box:
Far Ultraviolet (FUV1): 1331.56 – 1358.40 Å
Far Ultraviolet (FUV2): 1390.00 – 1406.79 Å
Near Ultraviolet (NUV): 2782.56 – 2833.89 Å
In the spectrograph, the light can travel several paths:
Spectrograph (SG): passing through a slit that is 0.33 arcsec wide and 175 arcsec long, onto a grating that is sensitive in both FUV and NUV passbands, then onto 3 CCDs to produce spectra in three passbands (FUV1, FUV2, NUV; Table 1)
Slit-Jaw Imager (SJI): reflected off the reflective area around the slit (“slit-jaw”), passing through or reflected off broadband filters on a filter wheel, then onto 1 CCD to produce an image of the scene around the slit in 6 different filters (2 for calibration, 4 for solar images, Table 2)
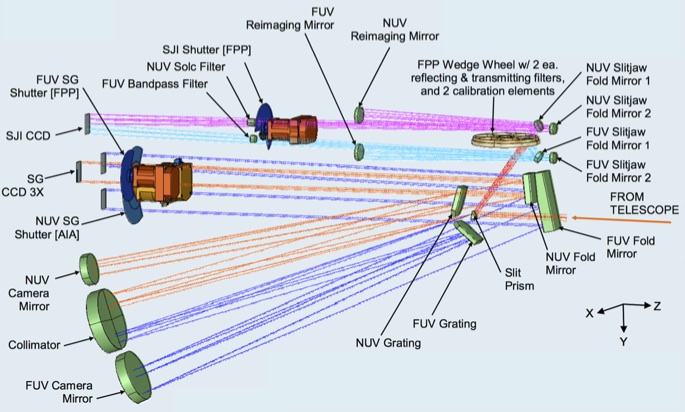
Schematic diagram of path taken by light in the FUV spectrograph (dark blue), NUV spectrograph (orange), FUV slit-jaw (light blue) and NUV slit-jaw (purple) path.#
Exposure times are controlled by 3 different shutters (FUV, NUV and SJI). Light is collected onto 4 CCDs which are read out by 2 cameras and which cover 3 different spectral bands and the slit-jaw images (Table 1, 2). The IRIS spectral lines cover temperatures from 4,500 K to 10 MK, with the images covering temperatures from 4,500 K to 65,000 K (and possibly 10 MK under flaring conditions). IRIS Technical Note 1 provides more technical details on IRIS.
Band |
Wavelength (Å) |
Dispersion (mÅ/pix) |
Effective area (cm2) |
Temperature (log T) |
|---|---|---|---|---|
FUV 1 |
1331.7–1358.4 |
12.98 |
1.6 |
3.7–7.0 |
FUV 2 |
1389.0–1407.0 |
12.72 |
2.2 |
3.7–5.2 |
NUV |
2782.7–2851.1 |
25.46 |
0.2 |
3.7–4.2 |
SJI Passband |
Type |
Wavelength (Å) |
FWHM (Å) |
Effective area (cm2) |
log T |
|---|---|---|---|---|---|
Glass |
T |
5000 |
2000 |
– |
– |
C II |
M |
1330 |
40 |
0.5 |
3.7–7.0 |
Si IV |
M |
1400 |
40 |
0.6 |
3.7–5.2 |
Mg II h/k |
T |
2796 |
4 |
0.005 |
3.7–4.2 |
Mg II wing |
T |
2832 |
4 |
0.004 |
3.7–3.8 |
Broad-band |
M |
1600 |
400 |
– |
– |
IRIS Data Level Definitions#
The convention on IRIS Data Levels is shown in Table 3 and at length in IRIS Technical Note 11. Raw spacecraft telemetry (TLM) is converted into Level 0 image files. Level 1 images are reoriented so that wavelength increases left to right. This constitutes the lowest level of scientifically-useful data, however since it is uncalibrated, Level 2 is the correct data product for most analyses.
The type of processing for data levels beyond 1 is dependent on whether the data is from the slit-jaw imager or spectrograph. Darks and pedestal offsets are removed, and flat-fielding corrections for telescope and CCD properties are applied to generate Level 1.5 data. The data at Level 1.5 has had the geometric and wavelength corrections applied and the images are mapped to a common spatial plate scale. Spectral images are remapped to align with an equal-sized array where wavelength and spatial coordinates aligned with the grid. An array mapping the wavelength axis to physical wavelength is created in this process. As with AIA, equivalent procedures to those used internally to transform level 1 to level 1.5 are distributed via SolarSoft as iris_prep.pro.
Levels 2 and 3 are generated from Level 1 or Level 1.5 data and are reorganized so that they can be analyzed using tools adapted from Hinode/EIS and SST/CRISP. Level 2 data consists of sets of 3D image extensions of each wavelength band stored as (λ,x,y) assembled from rasters of NUV and FUV Level 1.5 data. Level 3 data exist only for spectral rasters, and are 4D datacubes stored as (x,y,λ,t).
Note
Level 1 vs. Level 2 data: The spectral data of IRIS is distinct from many contemporary observatories like SDO. IRIS Level 2 data is equivalent to Level 1 data products of those other observatories. The Level 2 data are fully reduced, calibrated, etc., and packaged such that they are “shovel ready” for further analysis. On the other hand IRIS Level 1 data MUST be passed through the calibration routines iris_prep.pro by an expert user to reach only level 1.5. The transition from level 1.5 to level 2 is a non-trivial exercise in packaging the data and while the code is available, it is currently not being supported for general use. Therefore, we strongly recommend that everyone use the Level 2 data products.
Level |
Processing |
Notes |
|---|---|---|
TLM |
Capture
|
Raw telemetry
|
0 |
Depacketized
|
Raw images with basic keywords
|
1 |
Reorient images to common axes:
North up (0° roll),
increasing wavelength to right
|
Lowest distributed level
|
1.5 |
Dark current and offsets removed
Flag bad pixels and spikes pixels
Flat-field correction
Geometric and wavelength calibration
|
Transitory data product for level 2
production. Not distributed,
for internal use only.
|
1.6 |
Physical units (exposure and photon
conversion)
|
Not distributed.
|
2 |
Recast as rasters and SJI time series
|
Standard science product.
Scaled and stored as 16-bit images
|
3 |
Recast as 4D cubes for NUV/FUV spectra
|
CRISPEX format |
HCR |
Description of observing sequences
|
Ingested by HCR at LMSAL.
To be searched by VSO, etc.
|